Data analysis is a topic that gets a lot of lip service in today’s world. Although it is not a novel concept for small and medium businesses, it’s the big companies that primarily use it to their advantage. The rest are still struggling to understand its real value and to use it in a way to derive business growth.
To ensure that your business doesn’t get left behind, we compiled a list of five benefits of using data analysis to grow your business.
Helps identify the right client
For a small business owner, one of the first hurdles of digital marketing is understanding where they can reach their customers. Is it through advertising, a website or social media channels? To understand their online behaviour, you need to identify your ideal customer first.
Start off by going through your last 20 transactions and analyse each customer. If the information you have is not sufficient, give them a call or schedule a meeting with them saying that you’d like their feedback on your product, service, and business.

When you’re trying to get a deeper understanding of your customers try to look at it from these perspectives – the type of customer, what they purchased, the pricing range, what problems were they trying to resolve, what questions they asked, any concerns they mentioned and did you enjoy working with this client.
The more data you have, the easier it is to categorise customers into different groups, each representing a unique customer persona. By analysing your customer base, you are in a better position to identify your customer personas and know which of these personas are the most valuable to your business. This will help you target them better.
Validates decisions and removes biases
Data analysis also removes biases and helps businesses make better decisions. Many business owners tend to seek advice from family and friends or marketing gurus when it comes to making important decisions concerning their business. This will not always provide the best results because these advises and tips are not based on data that is related to your business.
If you’re wondering which social media channel you need to invest your time on to engage with customers, instead of opting for the channel you or your friends prefer the most, find out where your customers spend their time online. This will remove biases and preferences and ensure that you’re spending your time, efforts and money on the right channel which will lead to better engagement and therefore results.

Understanding your customers’ interests can give you an insight into their online behaviour. This will help you reach them on their preferred platform using content that resonates best with them. If you have identified customer personas that are important to your business as suggested above, this will help you to come up with a strategy to target them.
If you’re in the business of selling bikes specifically for kids then your ideal customer is a mother of young children. Find out if your ideal customer is active on Facebook groups, a space that is gaining a lot of popularity to share stories and gain tips. You can find Facebook groups categorised according to interests in Groups, which is just under the Explore tab on your news feed.
By implementing decisions that are backed by data, instead of opinions and biases, you have the potential to reach more people that matter to your business.
Supports continuous improvement
A business can grow in leaps and bounds if its strengths and weaknesses are recognised and improvements are made consistently. By analysing data regularly, you can find out what’s working and what’s not for your business. Using this information you can make effective improvements to your business and the processes involved to achieve better results.
Perhaps you have a website that is old and not mobile-friendly. A recent analysis of your website using Google analytics showed that most of your customers view your website via their mobile phone and you one look at the bounce rate on Google Analytics shows that majority of web visitors leave without nearly immediately without any interaction.

This data is invaluable and will highlight that the issue you have may not be in your marketing but your website is not converting the web visitors (traffic) to leads and sales. A deeper look may also reveal that those who remain may abandon their purchases half-way because they struggle to find the check-out page or due to a similar reason.
Based on these findings, now might be the right time to invest on a mobile-friendly website with a professional branding, and a design layout that engages the visitors within the first 2-4 seconds with a strong value proposition to your ideal customer. You can also improve other non-performing pages and usability issues such as easy access to the check-out page.
Once you have improved your website or got a new one and reduced your bounce rate you are now in a position to market to your business and also look into using retargeting advertising to remind customers of your business and any abandoned purchases.

The Next Step to Digital Empowerment of Small Business Owners
The Digital Bootcamp consist of 4-dynamic online modules designed to give you the right knowledge and tools of innovation to re-position your business and digitally transform for growth and success.
Minimise costs and increase efficiency
Conducting regular data analysis can help your business minimise unnecessary costs and increase efficiency. Ideally, a business should monitor its website and social media channels weekly and spend more time at the end of each month analysing this data. By doing so, business owners can identify which marketing and promotion strategies are not working and make informed decisions to stop promotions or adopt an alternative method which is more cost-effective.
For example, if you spend a lot on Facebook advertising, analysing the engagement and revenue it brings can help you decide whether it’s something you should continue, amplify or if it’s time to try something different. Similar to Facebook advertising, you can also analyse other channels that you’re investing in to bring in revenue and make it more profitable for you. These could vary from promotional activities to offers, find out what’s working and focus on that channel.
If you want to know more about Facebook advertising and how you can make it work for you, click on the link to read more on Facebook budgeting.
Helps you and your team be on the same track
Whether you’re a small or medium business, having all your team members on the same page helps you run a smooth operation. By monitoring and analysing your business’s data regularly, you have an insight into what’s truly driving your business and bringing in the results.

If your salesperson has noticed a sudden interest in fitness activities in your locality and communicates it to the rest of the team then they can come up with content and marketing strategies that can cater to this demand again once they have validated the sales persons observations using data that is often at our finger tips.
To derive the best results from data analysis, teams need to communicate their findings and discuss strategies together. This will help everyone to be on the same page and also keep track of their progress as a team.
Tools to help you with data analysis
Google Analytics
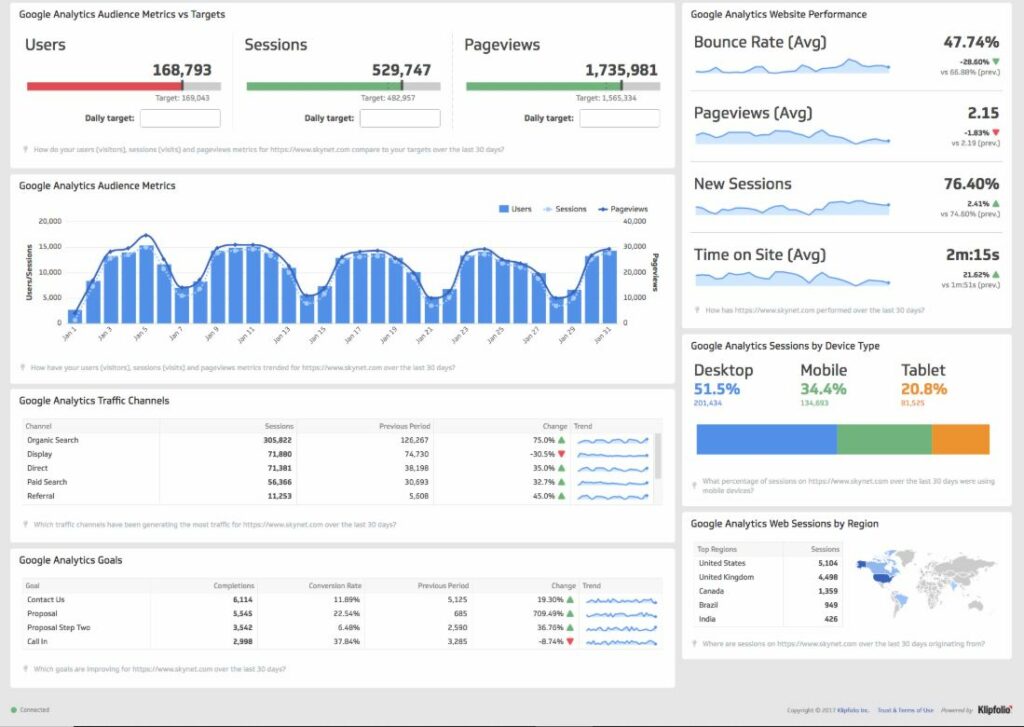
This is a free service provided by Google to track the performance of your website. The platform allows its users to identify many crucial factors of their website including, the highest and lowest performing pages, devices they use to access the website and insights to their audience, in terms of location and times they view the site.
Google analytics provides sufficient data for businesses to come up with a comprehensive analysis of their website and their customers’ journey on their site.

What to look out for?
User – This refers to the number of unique visitors to the website. This metric will help you understand if a particular page on your website generates more interest compared to another.
Bounce rate – This is the total percentage of users who visit a website and leave immediately without any further clicks on the page.
Session – Google Analytics starts recording a session as soon as someone visits your website. This includes the time it takes for the page to load and the session ends after 30 minutes of inactivity. Every click, pageview, and transaction is tracked during this time frame and is counted as one session.
Average Session Duration – This metric tells you how long on average a visitor stays on your website. It’s calculated by using the total duration of all sessions (in seconds) with the total number of sessions.
Pageview – If a user is loading or viewing a page on your website that is counted as a pageview.
Social Media Analytics
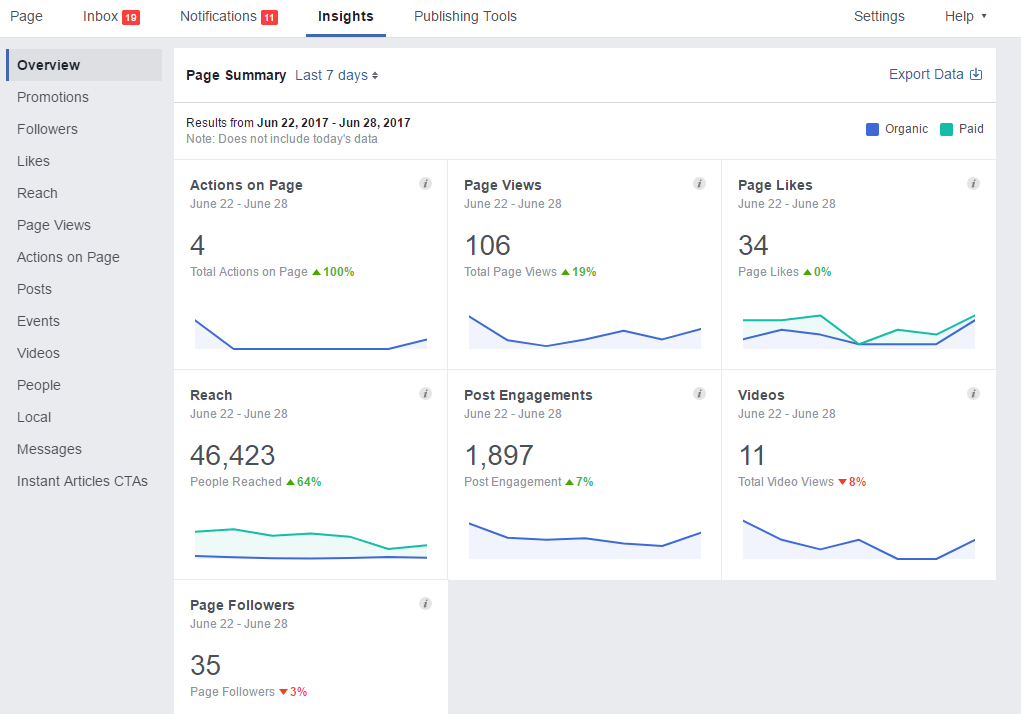
Each social media platform offers its own analytics dashboard. Facebook Insights, for instance, provides a detailed breakdown of the performance of a page and posts published on that page. You can learn about who is engaging with your page, their demographics, and location. These will help you understand what kind of content works best for your audience and how much money and time you should be investing in social media platforms. Similarly, Instagram, YouTube, Pinterest, Twitter, and LinkedIn have analytics dashboards.

What to look for:
Engagement – Likes, shares, comments, and clicks fall under this category. These metrics are a good indicator of how well content is performing on Facebook. Actions like sharing, commenting and clicking, in particular, show that the audience is displaying interest to connect with the brand apart from liking it.
Click through rate – This takes the number of clicks a post gets and divides it by the number of impressions. A low CTR means you have a high number of impressions and a low number of clicks and that your content isn’t resonating with your audience.
Reach – This metric indicates the number of people who see your content on Facebook.
Impressions – This number tells you how many times a post has been seen
Email Analytics
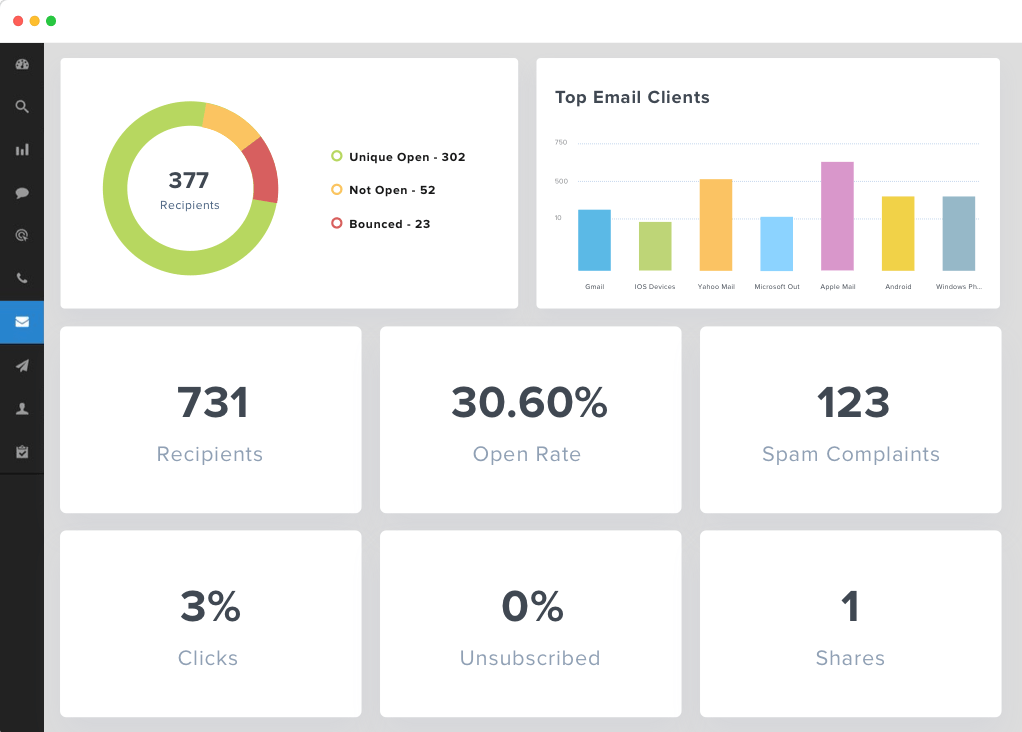
This is another important platform if your business sends regular emails to a customer base. By understanding and analysing metrics below you might be able to improve the content in your emails to ensure that your brand gets the attention it deserves.

What to look for:
Open rate – This tells you how many times your email has been opened.
Clicks rate – This number tells you the interaction the subscriber has had with your email by clicking links on the email, whether it’s to visit the website or read more.
Action rate over time – This metric will help you identify what time your subscribers are most interested in taking action with your emails.
Conclusion
Data analysis can no longer be ignored by small or medium businesses anymore. The benefits it brings to a company are invaluable and all business owners should make a conscious effort to invest the time to understand their business’s data.
Growth cannot be achieved if you are not willing to look at the results and fine-tune your strategies to cater to customers’ needs and wants. As mentioned earlier, this can lead to a streamlined operation that minimises unnecessary costs and focuses on how you can serve your customers in a more meaningful way.

Your first step to building a world-class website starts here.
A trusted brand is priceless for any business. We will help you build a compelling website that is respected in your industry and stands apart from your competition.


